Health
Track customization trends over time and identify degrading or stabilizing scopes. The Health Dashboard is designed for governance leads who need visibility into technical debt across application scopes.
Key Concepts
How Records are Classified
Every metadata record in a scope is classified into one of three categories based on its authorship and modification history:
| Category | Definition | Upgrade Impact |
|---|---|---|
| Customized | An OOB (out-of-box) record that was created by ServiceNow or a vendor, but later modified by a team member. The original creator is not a team member, but sys_updated_by is. | High — may break during upgrades when ServiceNow ships a new version of the same record. |
| Custom | A record created by a team member (not by admin, glide.maint, system, or ServiceNow staff). | Low — custom records are not overwritten during upgrades. |
| Untouched | An OOB record that has never been modified, or is protected by sys_policy (read/protected). | None — these records are safe to upgrade. |
The classification is determined automatically during each snapshot based on the sys_created_by, sys_updated_by, sys_mod_count, and sys_policy fields of each record. Records from sys_metadata, sys_db_object (tables), and sys_dictionary (columns) are all included.
Customized records are the primary risk factor for upgrades. When ServiceNow releases a new version, customized OOB records may conflict with the vendor's changes. The more customized records a scope has, the more work is needed to prepare for an upgrade.
Snapshots and Historical Tracking
Health data is captured as point-in-time snapshots during each scheduled refresh of your ServiceNow instance. Each snapshot records the customized, custom, and untouched counts per scope and class.
Snapshots are stored using a temporal table design, which means every historical snapshot is preserved. This enables:
- Trend analysis: See how customization levels have changed over time
- Delta calculations: Compare the current state against the previous snapshot
- Velocity tracking: Measure how fast customizations are increasing or decreasing
The comparison between the current and previous snapshot drives the trend direction (improving/stable/degrading) and the velocity penalty in the health score.
Snapshots reflect the state of metadata at the time of the refresh. If a refresh runs during an active deployment, it may capture a transitional state. This resolves automatically on the next refresh cycle. For the most accurate results, schedule refreshes during low-activity windows.
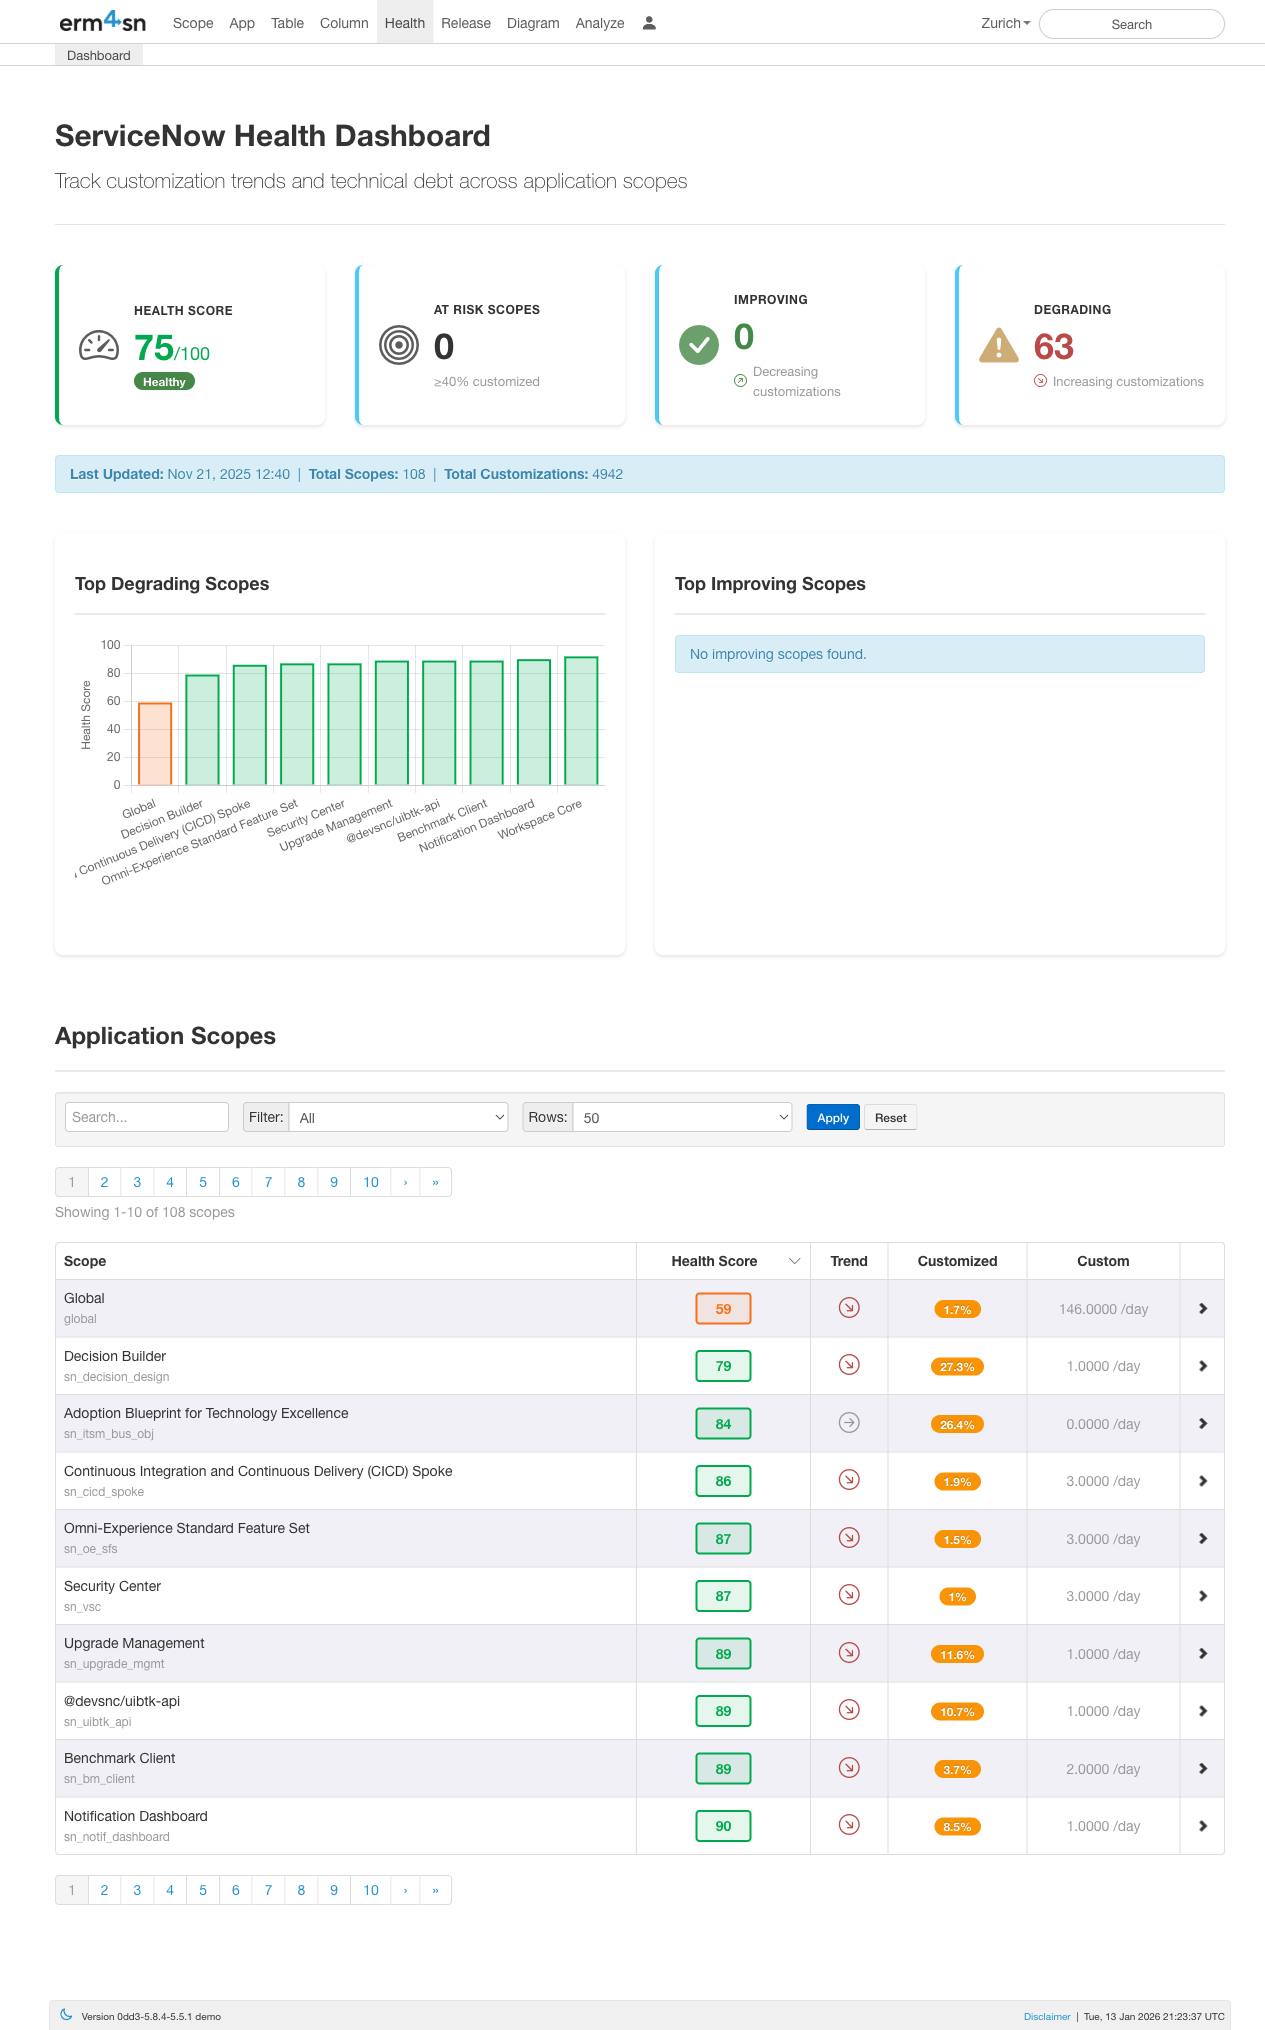
Dashboard Overview
The Health Dashboard provides an at-a-glance view of your ServiceNow instance's customization health:
- Health Score: Overall health rating (0-100) based on customization levels across all scopes
- At Risk Scopes: Number of scopes with ≥40% customization that may cause upgrade issues
- Improving: Scopes where customizations are decreasing over time
- Degrading: Scopes where customizations are increasing over time
The dashboard also shows summary statistics including total scopes monitored, total customizations tracked, and when data was last updated.
Top Degrading & Improving Scopes
The bar charts highlight which scopes are trending in the wrong direction (increasing customizations) and which are stabilizing. This helps you prioritize governance efforts on the scopes that need attention most.
Application Scopes Table
Below the charts, a searchable table lists all application scopes with their key metrics:
- Scope: The application scope name
- Health Score: Individual health rating for each scope
- Trend: Visual indicator showing if the scope is improving, stable, or degrading
- Customized: Number of OOB records that have been modified
- Custom: Number of new records created by your team
Use the search box to find specific scopes, or filter and adjust the number of rows displayed.
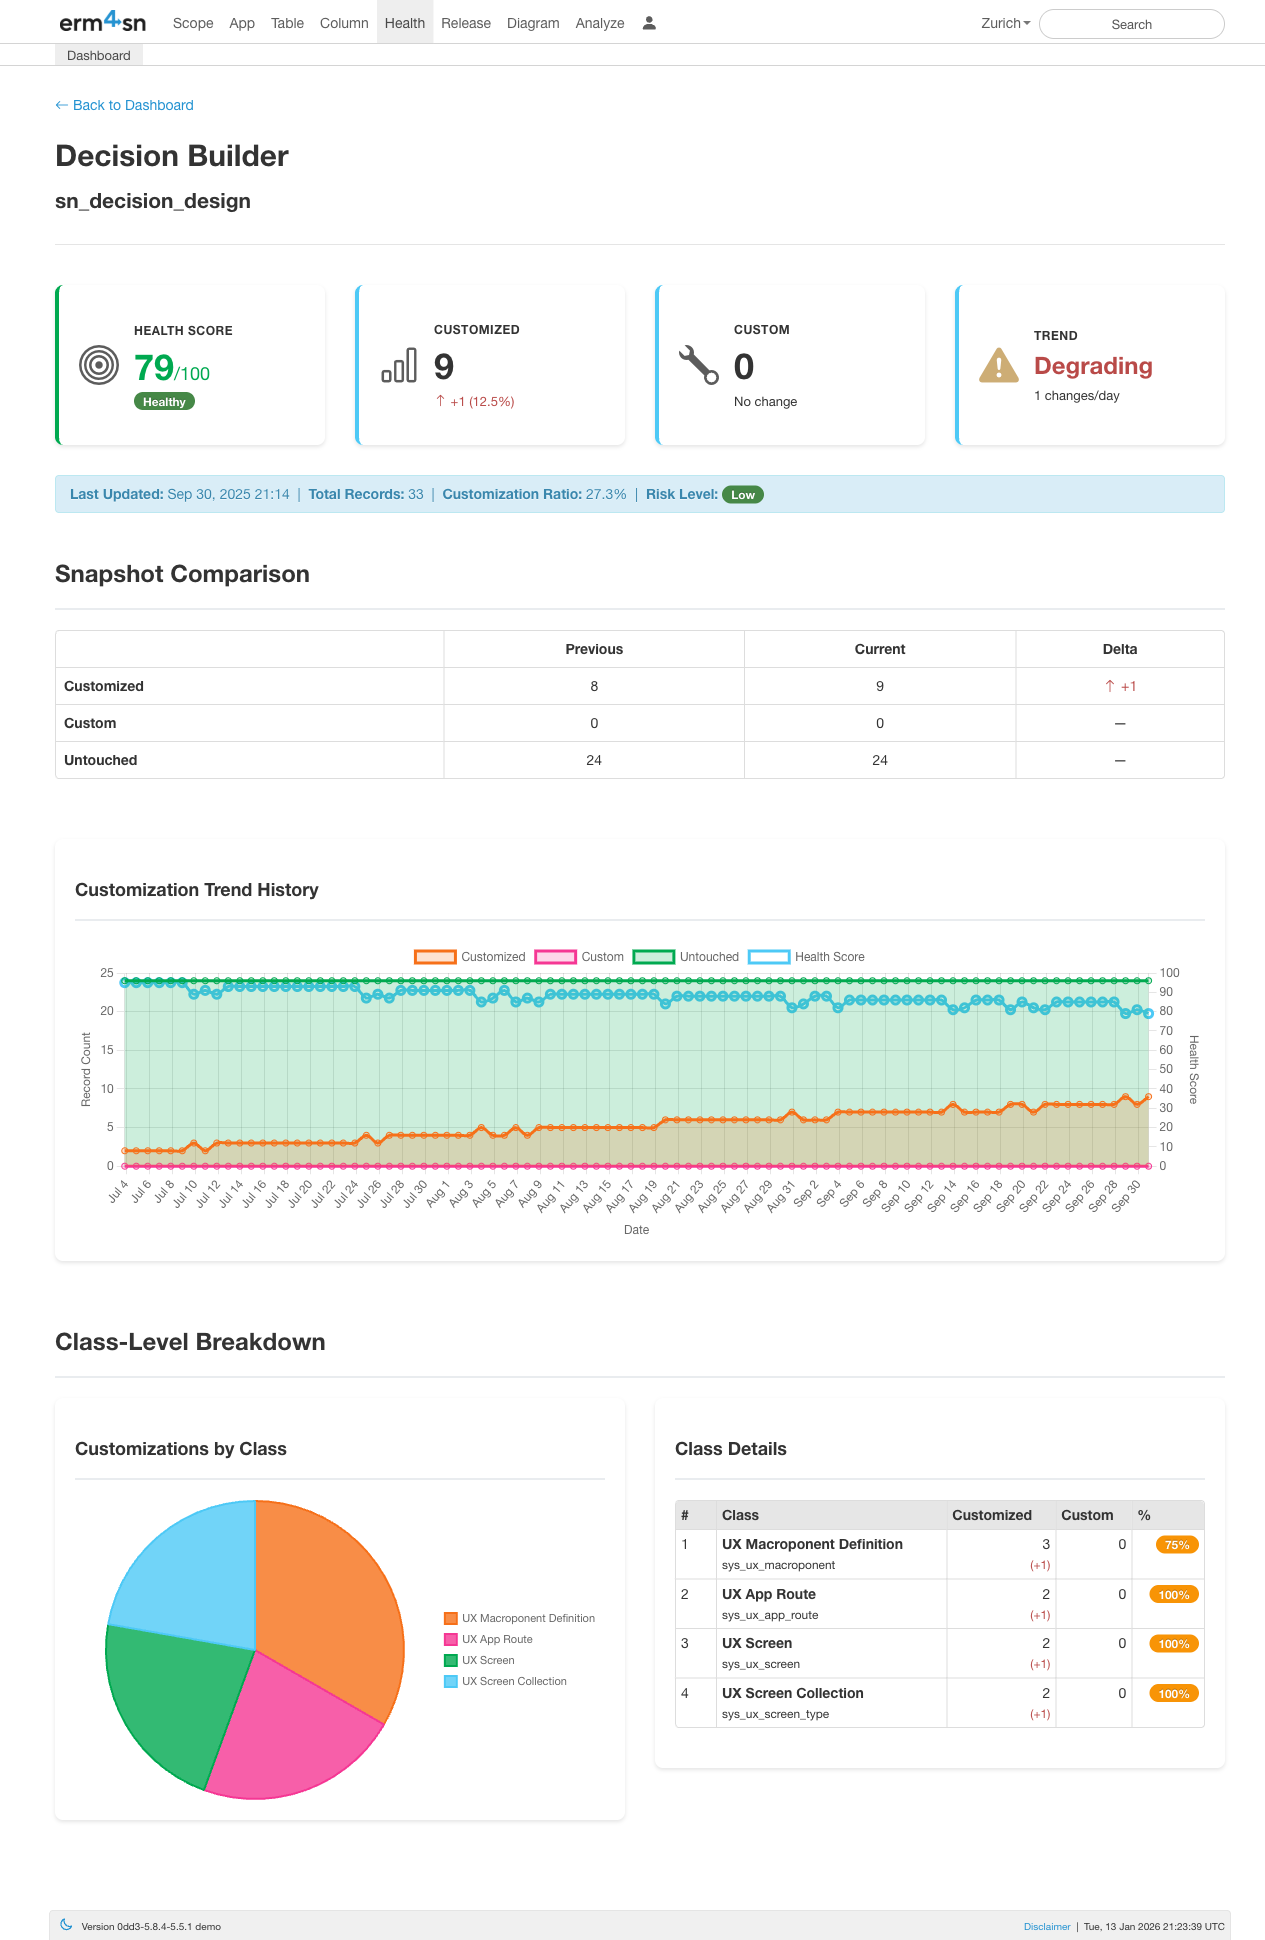
Scope Detail View
Click any scope to drill into its detailed health metrics:
- Health Score: The scope's individual health rating
- Customized: Count of OOB (out-of-box) records that have been modified (with change percentage)
- Custom: Count of new records created by your team
- Trend: Whether the scope is improving, stable, or degrading (with change velocity)
Additional context is shown including total records, customization ratio, and risk level.
Snapshot Comparison
The comparison table shows how customization counts have changed between snapshots:
- Customized: OOB records modified by your team (impacts upgrades)
- Custom: Records created by your team (neutral)
- Untouched: OOB records never modified (healthy)
The Delta column highlights exactly what changed, making it easy to spot recent modifications.
Customization Trend History
The trend chart visualizes how the scope has evolved over time with three key lines:
- Customized (blue): Number of modified OOB records
- Untouched (green): Number of unchanged OOB records
- Health Score (line): The calculated health rating over time
This helps you identify when changes occurred and whether governance efforts are working.
Class-Level Breakdown
At the bottom, a pie chart and table break down customizations by class type (e.g., UX Macroponent Definition, UX App Route, UX Screen). This shows exactly which types of records have been customized within the scope.
How the Health Score is Calculated
The health score rates each scope from 0 (critical) to 100 (healthy). It combines two factors: how much of a scope is customized, and how fast it's getting worse.
Formula
Health Score = 100 − Customization Penalty − Velocity Penalty
Customization Penalty (up to 60 points)
Measures the current customization level:
Customization Penalty = (customized / total records) × 60
A scope where 50% of records are customized loses 30 points. A scope with 10% customization loses only 6.
Velocity Penalty (up to 40 points)
Measures how quickly customizations are increasing compared to the previous snapshot. This penalty only applies when the scope is degrading — if the customized count is stable or decreasing, the penalty is zero.
Velocity Penalty = MIN(1.0, new customizations / 10) × 40
Each new customization since the last snapshot adds penalty, up to a maximum of 40 points (reached at 10 or more new customizations).
Score Examples
| Scenario | Customization Rate | New Customizations | Penalty | Score |
|---|---|---|---|---|
| Low customization, stable | 10% | 0 | 6 + 0 = 6 | 94 |
| Moderate customization, stable | 30% | 0 | 18 + 0 = 18 | 82 |
| Low customization, rapidly degrading | 10% | 12 | 6 + 40 = 46 | 54 |
| High customization, still growing | 50% | 5 | 30 + 20 = 50 | 50 |
| High customization, stable | 50% | 0 | 30 + 0 = 30 | 70 |
Special Cases
- Custom Apps (scopes created by your team, e.g.
x_*scopes): Always score 100. For team-built apps, having custom records is expected and healthy. - Stable scopes: Only the customization ratio matters — no velocity penalty is applied.
- New scopes (first snapshot, no previous data): No velocity penalty since there is nothing to compare against.
Health Levels
| Score Range | Level | Meaning |
|---|---|---|
| 71-100 | Healthy | Low risk, manageable customization |
| 41-70 | Warning | Elevated customization or active degradation |
| 0-40 | Critical | High customization and/or rapid degradation |
A scope with 30% customization but stable numbers is less urgent than a scope with 15% customization that gained 10 new customizations since the last snapshot. The velocity penalty ensures rapidly degrading scopes get flagged before they become hard to fix.